
2025 Salary Report for U.S. Physical Therapists

Physical therapy (PT) remains a highly valuable healthcare service, seeing consistent salary growth. This report provides data on national averages, state‑by‑state breakdowns, historical trends, and future projections for PT salaries in 2025.
National Average Salary (2025)
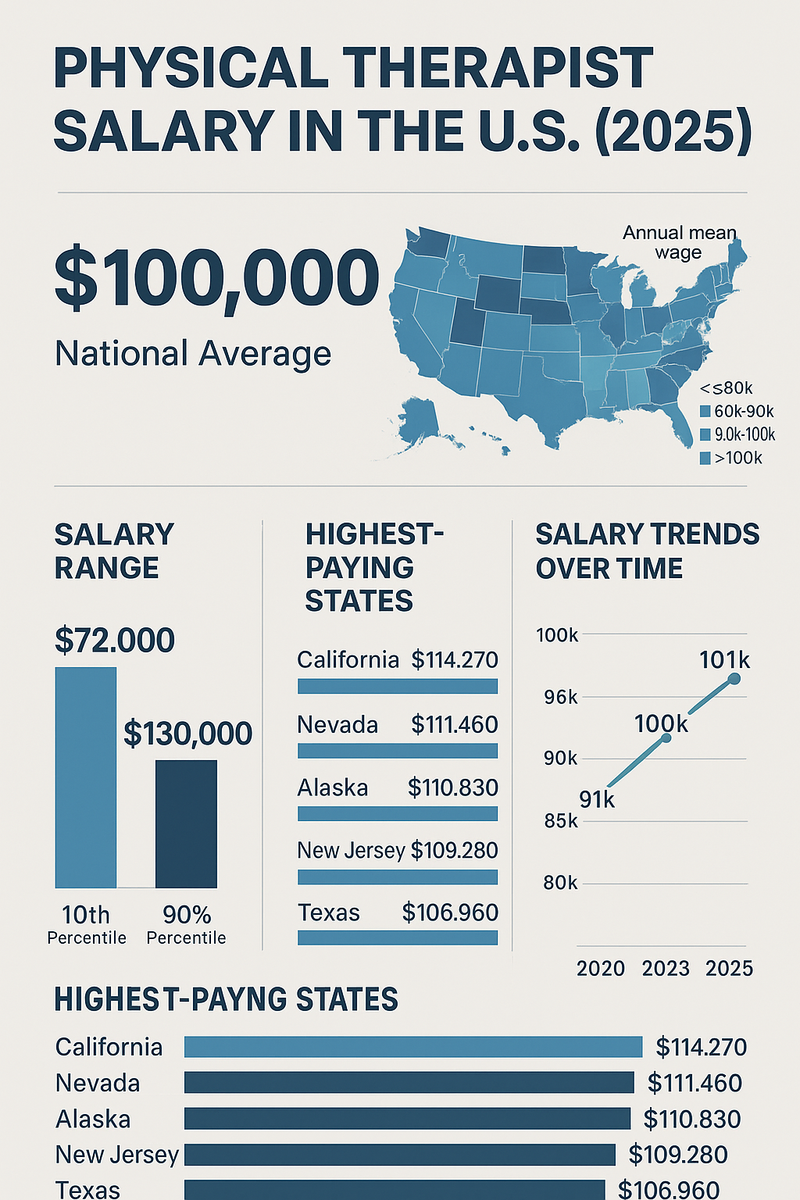
In 2025, the national average salary for physical therapists is approximately $101,020 per year, or about $48.50 per hour.
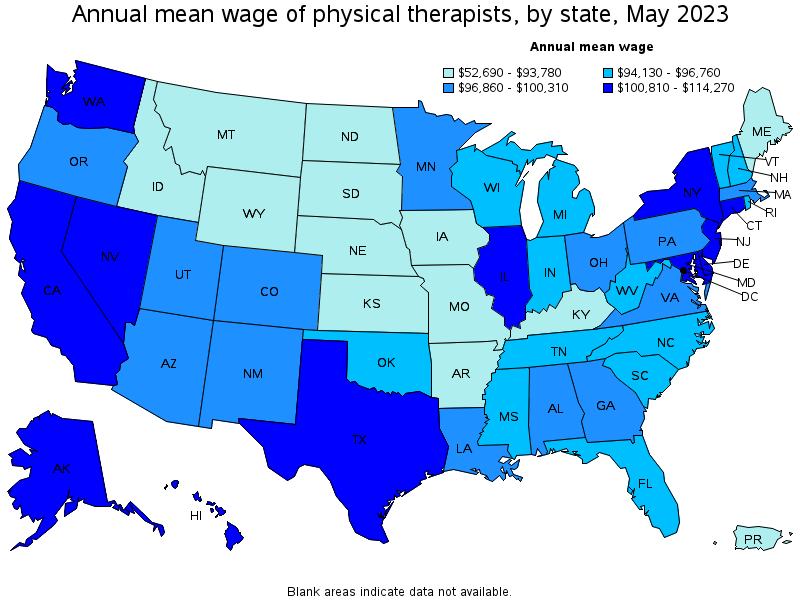
Figure: Annual mean wage of physical therapists by state (BLS, May 2023). Darker blue states have higher average salaries for PTs, while lighter areas have lower averages. Blank areas indicate data not available.
Salary Distribution:
Percentile | Salary (Annual) |
|---|---|
10th | $72,260 |
25th | $82,000 |
Median (50th) | $101,020 |
75th | $119,500 |
90th | $130,870 |
Historical Salary Trends (2020-2025)
Year | Median Annual Salary | Year-over-Year Change |
|---|---|---|
2020 | $91,010 | N/A |
2021 | $95,620 | +5.1% |
2022 | $97,800 | +2.3% |
2023 | $99,710 | +1.9% |
2024 | $101,020 | +1.3% |
2025 | $102,500 (proj.) | +1.5% (proj.) |
State-by-State Breakdown (2025)
Top 5 Highest Paying States
Rank | State | Average Annual Salary |
|---|---|---|
1 | California | $114,270 |
2 | Nevada | $111,460 |
3 | Alaska | $110,830 |
4 | New Jersey | $109,280 |
5 | Texas | $106,960 |
5 Lowest Paying States
Rank | State | Average Annual Salary |
|---|---|---|
1 | Louisiana | $65,500 |
2 | Georgia | $66,800 |
3 | Florida | $68,400 |
4 | North Dakota | $71,600 |
5 | Mississippi | $78,500 |
Factors Influencing Salary Variations
- Cost of Living: High salaries in states like California reflect high living costs.
- Healthcare Demand: Higher-paying states typically have stronger demand for healthcare services.
- Setting and Experience: Salaries vary significantly based on workplace settings and experience levels, with outpatient care centers typically paying more.
Future Salary Projections
The demand for PTs is expected to grow by approximately 14% from 2023 to 2033, suggesting continued upward pressure on salaries due to increased demand for services related to an aging population.
Conclusion
Physical therapy salaries continue to grow modestly, tracking closely with inflation and demand. Geography plays a significant role, with notable state variations. PTs should consider regional living costs and industry demand when evaluating salary offers.
Frequently Asked Questions
ABOUT THE AUTHOR
Gal Steinberg
Co-founder
Gal is a health tech expert focused on integrating cutting‑edge technologies to improve patient care and operational workflows.

Reduce burnout,
improve patient care.
Join thousands of clinicians already using AI to become more efficient.
Suggested Articles

Expert Advice
10 Best Therapy Notes Software in 2025: Benefits & Features
Discover the best Therapy Notes Software in 2025, including key features, benefits, and pricing, to simplify clinical documentation and enhance patient encounters.

Expert Advice
The Future of Medical Transcription
Discover how AI scribes are revolutionizing medical transcription with real-time, accurate, and cost-effective documentation. Find out what’s next!

Expert Advice
How to Write SOAP Notes: Examples & Template
Learn how to write effective SOAP notes with examples, templates, and best practices. Improve documentation with our detailed guide.
Security & Legal
Our technology is HIPAA-compliant, uses industry best practices, and doesn't store patient recordings.
Privacy Policy Terms of Service Terms of Use Help Center Blog Templates Alternatives & Comparisons Medical Coding Hub

© 2024 by Ravel Technological Solutions LTD.

